The Magento Profiler is used to identify performance problems on the server side. The Profiler can help you find PHP functions which use up too much CPU or functions with slow database queries.
These problems will first be noticed if you have high load on your server. Apache processes can be seen using “top”, where you will see apache or httpd processes jumping to the "top" using a large percentage of CPU.
Using the Profiler requires a fairly deep (e.g. time consuming) analysis, so make sure you are barking up the right tree before proceeding with this. You’ll want to eliminate any front-end issues (such as loading large png files, too many css or javascript files, content compression, unnecessary Javascirpt, etc.) to be sure your problem is really server side (The “YSlow” firebug plugin is a good resource for client side problems).
Magento is very resource intensive, and many shared hosts will not be able to run it with decent performance.
Make sure your problems are not related to your database. Login to MysQL. Run show “process list”, as you go browse through the slow areas of the site. If any queries stay on the screen as you watch, you probably have a database performance problem.
Finally, make sure your problem is not a networking relating issue, such as a slow or faulty internet connection, or firewall.
Generally, look for the first page hit using Firebug Net view to see the total server side time required to generate the page. The Magento profiler is limited to this first page hit - so make sure you know how much performance you can actually gain. Focus on the greatest performance as a percentage of the overall time to view the page, to be sure you are getting low-hanging fruit first.
Be sure you know what's going on with your cache. If you are using caching, the difference between the first and subsequent hits can be huge, and will throw confusion into the mix, giving you meaningless results. I recommend adding some comments using PHP error_log() function, (tail -f the web error log), so you know when the Full Page Cache is used. See my previous blog post on the Full Page Cache.
As with many Magento problems, I’ve given up trying to find documentation or explanations online. Although the architecture is technically beautiful and the code very well written, documentation can be very spotty. You can occasionally strike gold on the community site, but I’ve found the most direct way to approach many Magento problems is to read the source. Once you go through the code, you find out that the feature wasn’t as complicated as you thought it was. It’s this way with the Magento Profiler.
However, in this post, I’ll try to save you some pain reading the source, by sharing some experiences on how I’ve used the Profiler.
I’m assuming your running Magento Enterprise 1.8.
First, enable the profiler via System -> Configuration -> Developer -> Profile (yes). This enables the profiler, but does not fill in any of the benchmark times.
Comment out the following line in
# toggle this to enable profiler.
Varien_Profiler::enable();
Next, refresh the page you are optimizing. At the bottom of the page, you will see the performance table.
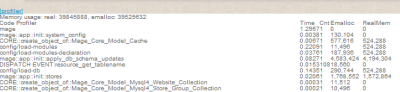
Fig 1: Magento profile data at bottom of page.
This table is impossible to read directly inline, since the HTML is placed outside of any HTML or body tags. Go into the source and copy the entire page contents. Paste in Notepad or any other text editor. Eliminate the regular page HTML , leaving only the HTML which builds up the performance data table. Save to a temporary HTML file and then view via Internet Explorer to view the static page. (IE allows you to copy the table from HTML to Excel)
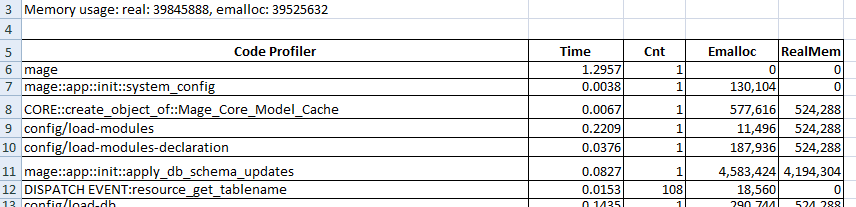
Fig. 2: Magento stats loaded into Excel. (Click to enlarge.)
The call to Mage::app should be at the top of the list. This is the full time of your request is taking to run on the server (minus process startup). It’s what you want to reduce as much as possible. The code found in app/Mage.php is what "marks" the start and end points to profile.
Varien_Profiler::start('mage');
... core magento code ...
Varien_Profiler::stop('mage');
I Ignore the memory usage stats. (If you’ve figured out how to make these egregiously large numbers have any meaning, leave me a comment.) Under normal conditions, Magento chews up around 50 Megs of memory per process. If you are running data loading scripts, it can use up much more memory if there are repeated instantiations of Magento objects (users, products, etc).
The number of instantiations is very meaningful, as it will tell you if there are unnecessary objects) being made, possibly through some customizations you've made. But don’t assume the Magento code is perfect either. We found out that any more than 10 shopping cart rules will slow the performance of the cart to a crawl, due to repeated calls to EAV load table. (NOTE: EAV load calls are very expensive, performance wise. Each one costs about 1/10 of a second. I'll post another blog article on that solution if it will help someone - let me know.)
The column "Time" indicates the total time spent between the "start" and "stop" calls within "Cnt" instantiations. To resolve your performance problem, look for large numbers of instantiations, resulting in large "Time" values within this report.
Use recursive grep on the source to find out what is being measured within the profile report. E.g.
grep -r "Varien_Profiler::start('mage'" *
Also, you should be able to add your own Varien_Profiler::start() and stop calls within the code (though I haven't done that).
Good luck and I hope this article helps with troubleshooting your Magento performance problem. Leave me a comment if you have more information or need some help.